It seems obvious that trees impact our communities in a beneficial way by providing shade and lowering temperature, absorbing carbon dioxide, and intercepting and absorbing rainfall. But quantifying these benefits can be challenging. Fortunately the USDA Forest Service “provides urban and rural forestry analysis and benefits assessment tools” that can help us. The USDA developed these through a public-private partnership with Davey Tree Expert Company, The Arbor Day Foundation, Urban and Community Forestry Society, International Society of Arboriculture, and Casey Trees. What surprised me is that these tools known as i-Tree have been around since 2006.
You can access the website to learn more about these tools here: i-Tree Website. The i-Tree site lists a suite of tools for assessing impacts of both individual trees and tree canopies. And there is a tool to help you select the species based on your location.
The i-Tree website also has a lot of resources to help you in learning how to use their tools. You can visit their support page to access manuals, guides, workbooks, and reports from users. For example, they list a link to a Story Map site set up by Abington Township Montgomery County, Penn., a community which made use of the i-Tree suite. And while this community is in the United States, the use of i-Tree is not limited to the U.S. The i-Tree site also lists information regarding its use internationally with examples of its use in other counties.
The other day a colleague told me about a bean field in Polk county, Minn., which catastrophically dropped 25 feet. After watching the video I noticed the land was located near a river, and the video points out that the land also seems to be pushing into the river. It made me wonder if some types of geographical features I had thought developed gradually over time instead occasionally occur all at once as this did. And now will this sunken area present to the river a path through which a new meander of the river may be created?
Then today in reading the history of Richland county, Ohio, I came across another story of a catastrophic drop in land which occurred in 1846 in an area about seven miles east of Mansfield. The area is now covered by several acres of water and is called Sites Lake – a small lake lying close to and north and east of the much larger Charles Mill Lake. But according to the history, Sites lake, which used to be called Uncle Jonas’ Lake, was at one time only about an acre in size. The story explains that the area around the lake, amounting to about eight acres, was very flat and rimmed with “hills of gentle slope.” So the owner of the property, who was the Uncle Jonas after which the lake was named, decided he would drain the lake and recover an extra acre of farm ground. To achieve this goal, he cut a ditch through the only break in the hills lying around the flat acreage so the water could drain from the lake to the “Black Swamp” which lay to the east. He completed his work on July 25, 1846, and successfully lowered the water level by eight feet.
Imagine Jonas’ surprise when instead of gaining more flat, dry land, he found the flat area around his lake had dropped and became flooded with water. Only the tops of trees could be seen and eventually over time even these too sunk out of sight increasing the size of the lake to six acres. Neighbors from miles around reported feeling a “quake and tremble” at the time the land catastrophically sank. Then, through the years, the land continued sinking until eventually the lake reached a size of eight to nine acres.
Later in the 1900s work was done to significantly develop the area around Uncle Jonas’ Lake. Today it is dwarfed by the much larger Charles Mill Lake which, according to the Charles Mill Lake website, is 1350 acres in size.
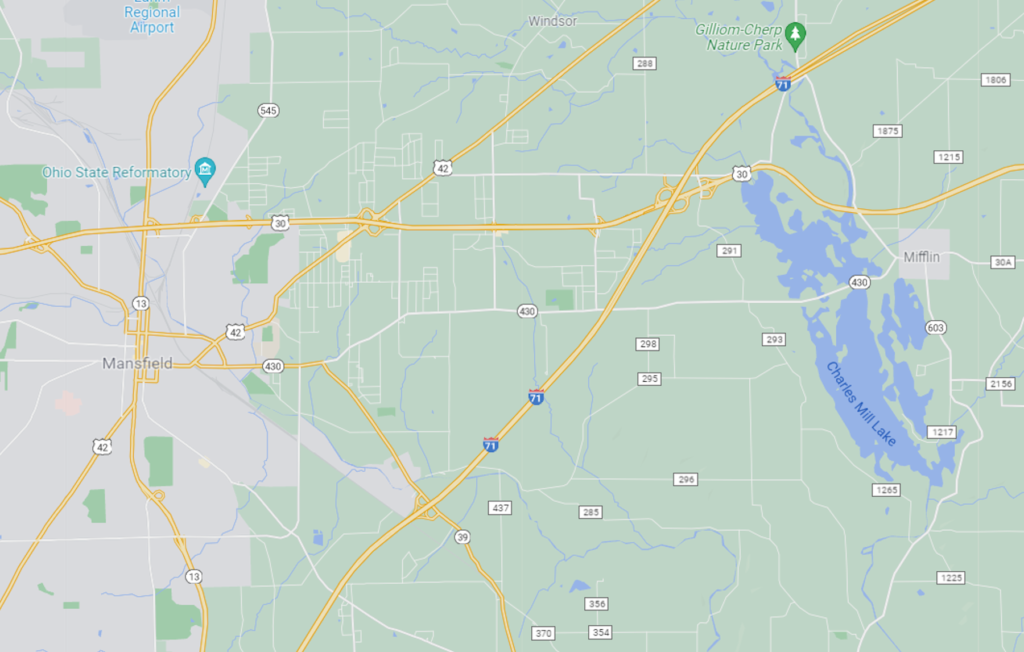
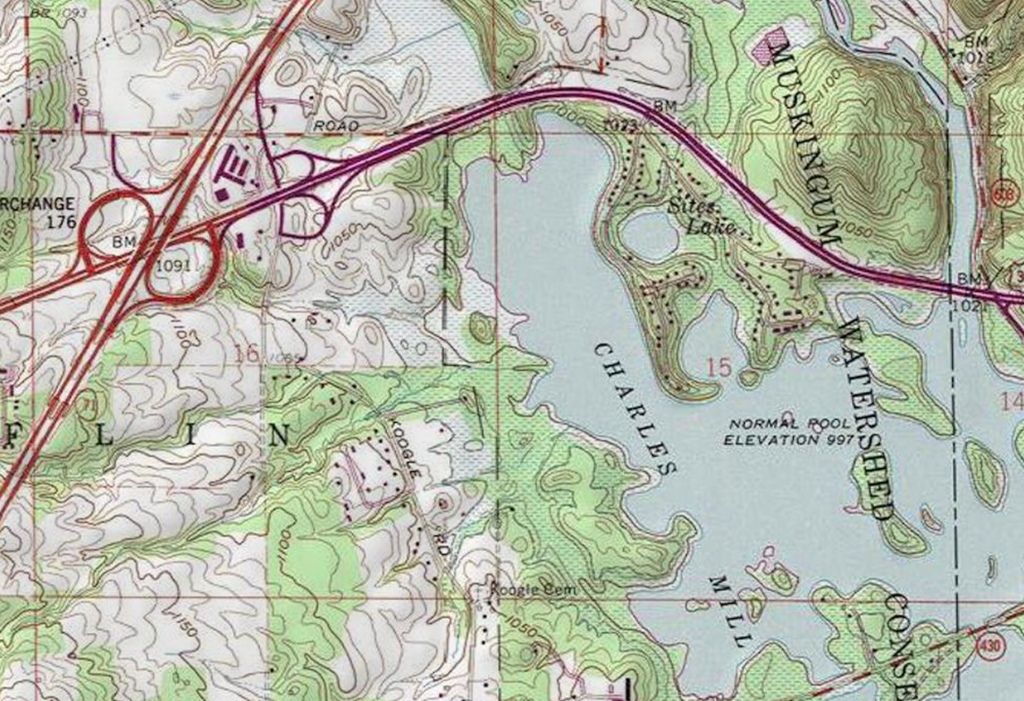
A map showing Charles Mills Lake which is located about seven miles east of Mansfield, Ohio. Uncle Jonas’ Lake is one of the smaller lakes lying just to the north and east of Charles Mills Lake. Uncle Jonas’ Lake is now called Sites Lake. Source: Google Maps.This map shows the location of Uncle Jonas’ Lake, now called Sites Lake, just north and east of Charles Mill Lake in Section 15 in Mifflin Township. Source: National Map.
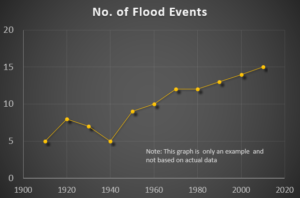
Lately I’ve seen several presentations which all include a similar slide with a graph like the generic one I created below. All the presenters then refer to the graph on the slide and make a statement similar to this: “and because of climate change you can see an increase in flooding over the last several decades.” But with no supporting data ever offered to attribute this trend to climate change, these graphs have instead made me think the cause is most likely sewage.
Graph – for example only; not based on actual data
So how do I get sewage out of this? Well, first it helps to have a background in the history of water distribution and wastewater treatment in the U.S. While some major cities began piping water to homes in the 1800s, construction of water distribution systems didn’t began in most areas until the early 1900s. At this time, wastewater in most areas was still discharged without central collection or treatment. According to Urban Wastewater Management in the United States: Past, Present, and Future, “By 1905, more than 95 percent of the urban population discharged their wastewater untreated to waterways. Little changed over the first quarter of the twentieth century,
and in 1924 more than 88 percent of the population in cities of over
100,000 continued to dispose of their wastewater directly to waterways.” Because this led to a non-centralized system, sewage was sometimes sent directly to a stream from multiple outlets and sometimes dispersed over land to eventually make its way to a stream.
All this began to change in the mid-1900s. The same publication cited above also noted Congress enacted “the Water Pollution Control Act of 1948. The legislation provided for comprehensive planning, technical services, research, financial assistance, and enforcement. The Water Pollution Control Act was extended in 1952 and became permanent legislation in 1956.” There was a 1965 amendment to this act, and then eventually in 1972, Congress passed another Water Pollution Control Act.  The paper points out “the 1972 Act set the unprecedented goal of eliminating all water pollution by 1985 and authorized expenditures of $24.6 billion in research and construction grants.”
The result of this flurry of legislative activity between 1948 and 1972 resulted in the installation of centralized wastewater treatment systems in urban areas across the U.S. Today all discharges from each of these systems are regulated through permits from the USEPA primarily for water quality control. The discharges are typically introduced to a stream or other body of water directly from the treatment plant. Treatment discharges have the potential to range from less than 1 million gallons per day (MGD) to 1.44 billion gallons per day. That’s a lot of water entering our streams on a continuous basis which is why I immediately thought of wastewater as a cause when I saw the graph trending up after the mid 1900s.
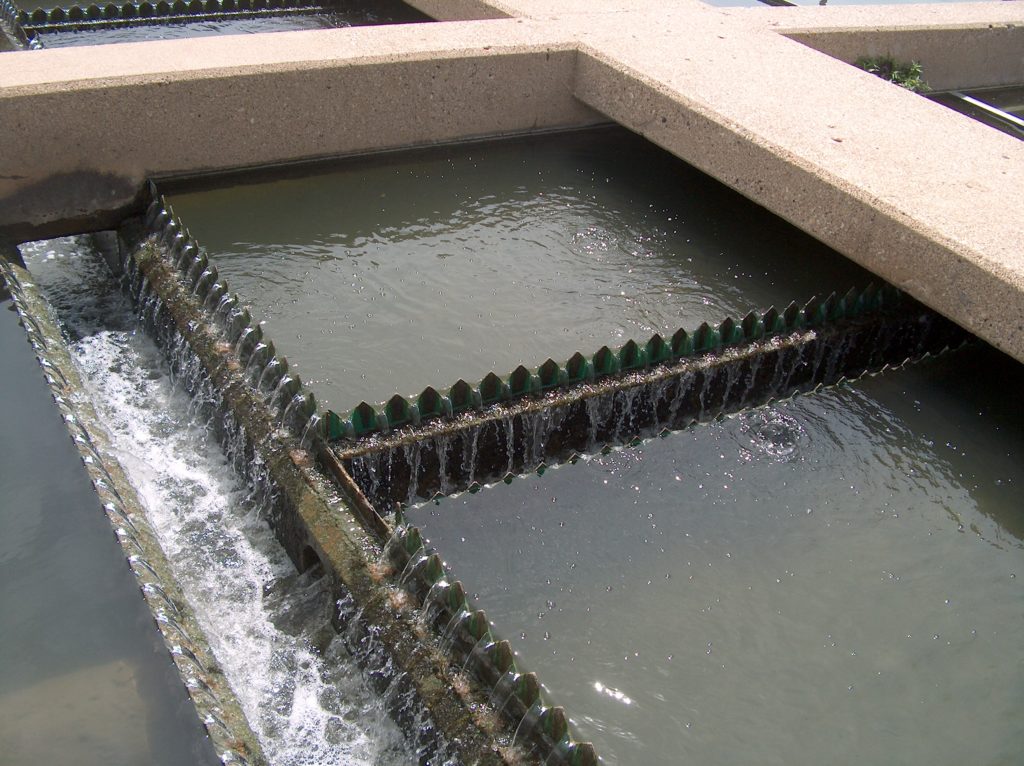
Wastewater clarifier
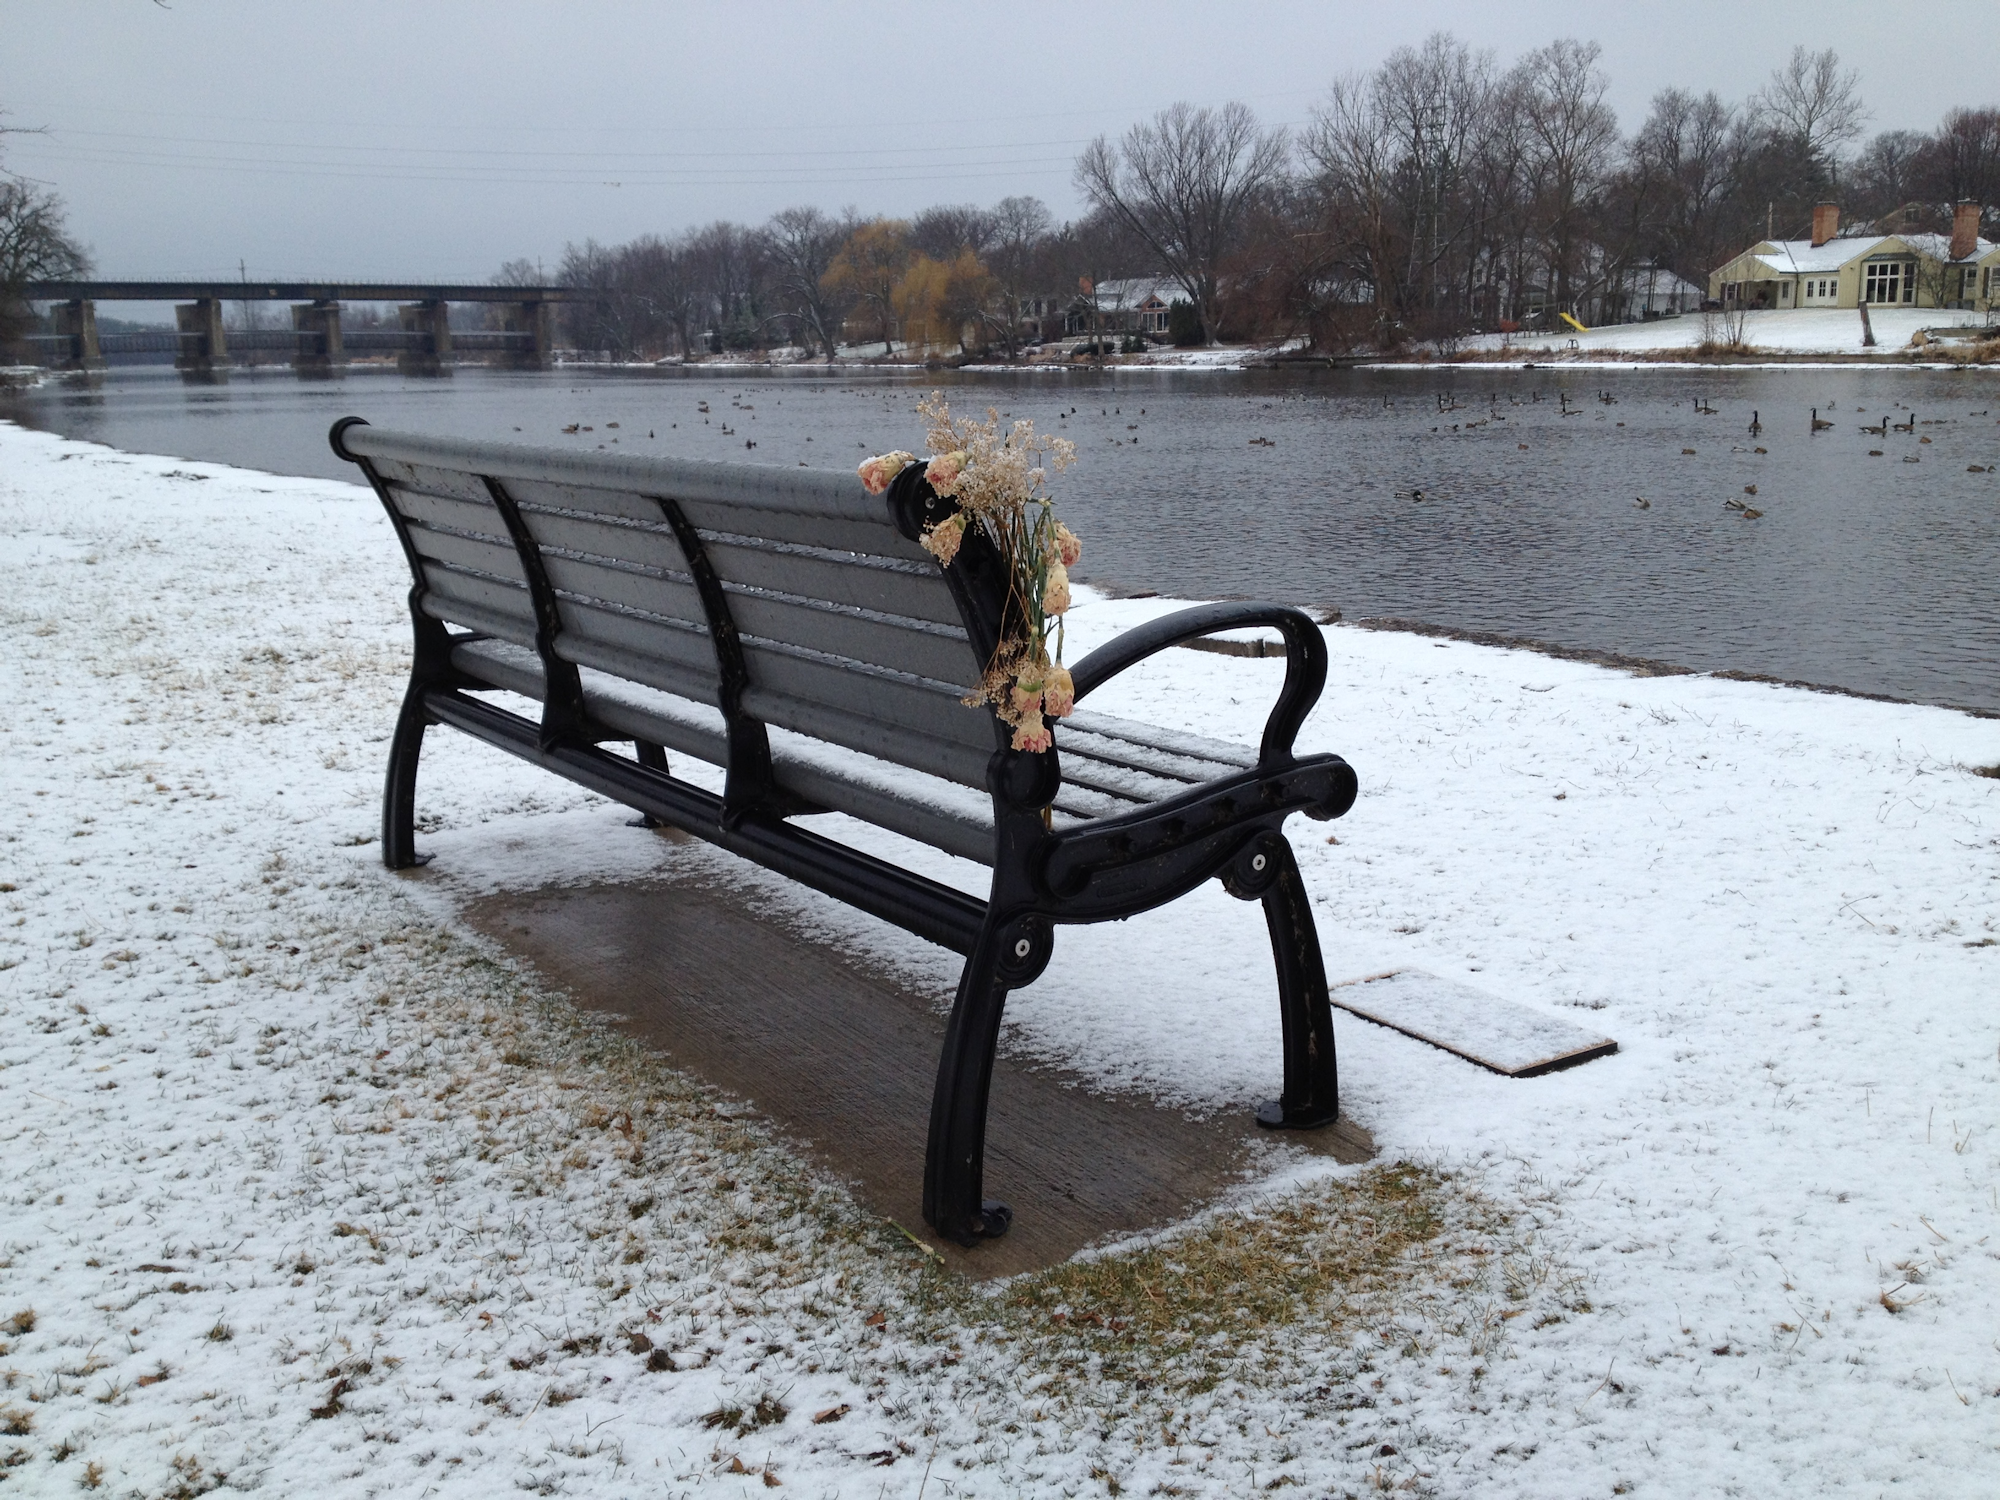
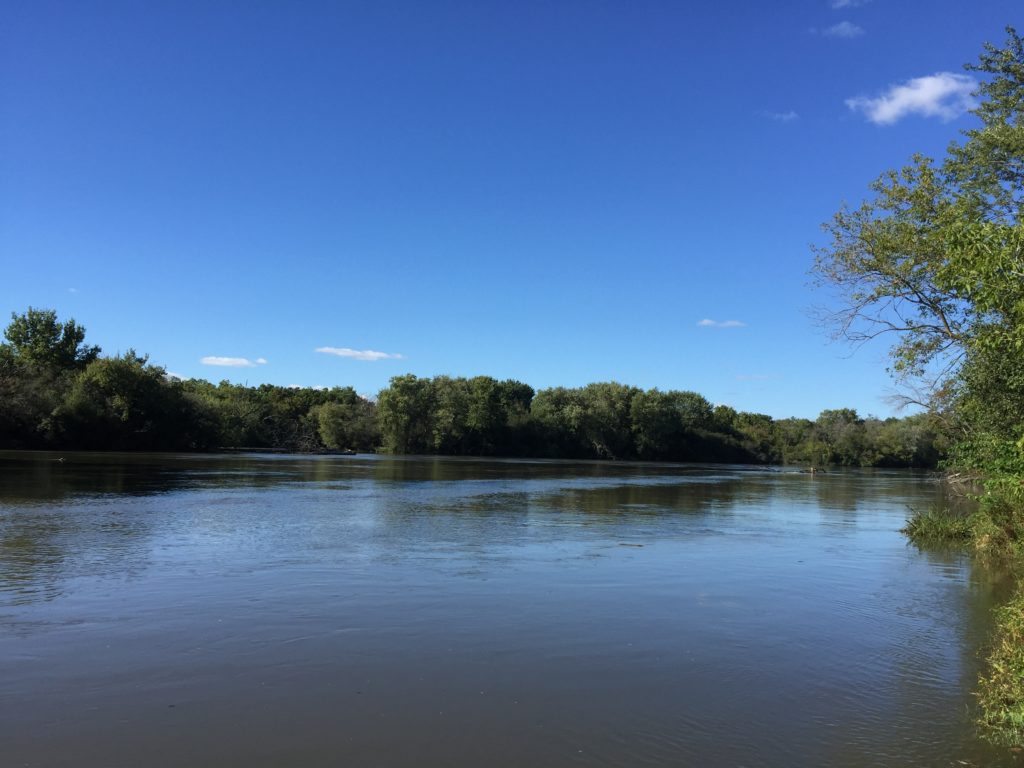
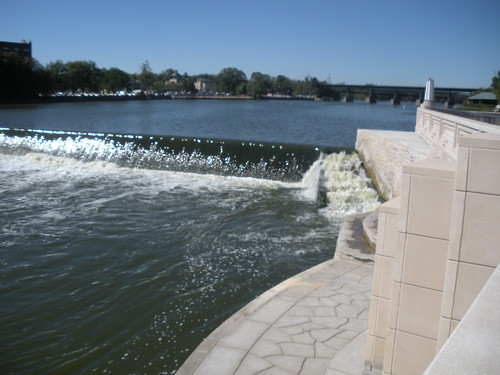
Another reason I suspected wastewater had a major impact on stream flow was based on something I heard regarding the river flowing through our city. It seems in the past, people could walk across the river in the summer. As you can see in the photo of this river which I included at the start of this article, walking across the river today would most likely never be possible. In hearing this, there was no question in my mind that this was due to the wastewater discharges which now regularly flow into our river and increase its base flow.
So during the last presentation I attended, I asked if impacts from wastewater discharges were considered or analyzed to see how much these flows are contributing to increased flooding. I explained if prior to installation of wastewater treatment plants, base flows of rivers could reduce to almost nothing, these streams would have had more capacity to handle rainfall events. But now with increased base flow due to wastewater discharges, which really started entering streams between 1948 and the 1980s and continue to do so and increase, the ability of streams to handle rainfall events has decreased. This could be a cause of rainfall events impacting greater areas and resulting in increased damages in suburban areas. Also, as this USGS site shows, How Much Water Do We Use?, public water supply usage has increased over the years which would increase wastewater discharges even more. The presenter said they had never looked at the impacts of wastewater discharges.
As I continued to wonder about this, I looked online to see if others had thought of the impact of wastewater discharges on flooding events and discovered yes, they have. I even found studies which were done on the river in my community. H. Vernon Knapp, senior hydrologist with the Illinois State Water Survey, has developed at least two studies for the Fox River in Illinois which related to this topic. In his paper, the “Fox River Basin Streamflow Assessment Model: Hydrologic Analysis, October 1988,” he analyzes the river flow taking into consideration impacts from effluent discharges from wastewater plants along the river. According to Knapp, in 1988, “approximately half of the low flows in the river upstream of these plants originated as effluent discharges from other facilities. Under these circumstances, the capacity of the Fox River to assimilate the additional effluents should be of concern.” His paper is also informative regarding other factors which can impact stream flow.
More recently Knapp developed a presentation, Effects of Future Water Demands and Climate Change on Fox River Water Availability. In it he states “watershed modeling suggests that the potential effect of climate change on Fox River low flows is considerably less than the effects of effluents and withdrawals, and thus does not substantially alter the water supply potential of the river.” He also notes “low flows in rivers such as the DesPlaines are almost 100% effluent.”
Perhaps not all increased flooding in all watersheds can be directly attributable to increased wastewater discharges since the 1940s, but I’m surprised it’s not always at least considered. Instead increased flooding events have been attributed to climate change, yet I could find no study which directly proves this. Most studies only look at the extent of flooding and make the leap with no specific data to back up the claim that this is due to increased precipitation brought on by climate change. A few studies I found also indicated there are too many factors other than just precipitation, such as antecedent water content, soil type, topography, etc., to conclusively make a direct correlation between increased rainfall and increased stream flow.
In the future, I hope to find more studies which do take into account the impacts of wastewater effluent on river flow and flood events to see if others have findings similar to Knapp’s.
There's been an ongoing legal dispute in Iowa between the Des Moines Water Works (DMWW) and drainage districts in three Iowa counties to decide who should pay the price to clean up polluted water. It's an interesting case for those of us who are involved in stormwater regulation and water treatment. And it is one more step in the ongoing struggle to determine how best to protect the environment and who is best positioned or most responsible to pay that cost.
Background on the DMWW Case
According to the final ruling document (No. 16-0076), DMWW "is a municipal water utility … that provides drinking water to an estimated half-million Iowans in the Des Moines area." Their water sources are primarily the Racoon and Des Moines Rivers. The watershed for the Racoon River is about 2.3 million acres in size and spans 17 counties in Iowa. DMWW stated in their complaint filed in federal court that "from 1995 to 2014, nitrate concentrations in the Racoon River at the DMWW intake points exceeded the 10 mg/L standard for drinking water at least 1636 days, or 24% of the time." Example concentrations mentioned in the complaint are 11.98 mg/L, 13.23 mg/L, 11.89 mg/L, 13.43 mg/L, and 12.56 mg/L. Therefore in order to provide water to its customers that meets drinking water regulations, DMWW incurred costs at its three treatment plants to reduce this level below the standard. DMWW also noted the need to expend funds in the near future to construct a new facility to handle the continuing elevated levels of nitrate.
In an effort that appears to force a reduction in or capture of these costs, DMWW filed a petition in federal court on March 16, 2015 (Trial Case No. C 15-4020-MWB). According to the Order Certifying Questions to the Supreme Court, the complaint basically alleges the drainage districts, or defendents, are "responsible for the increasing nitrate concentrations in the Racoon River." And because DMWW provides water to its customers from this river, which now has elevated levels of nitrate, it must incur costs it would not otherwise have to in order to reduce these concentrations below regulated standards.
On the defendent side, the drainage districts argued they were not the proper party for this lawsuit. They also indicate that other agencies of the state and federal government are responsible for regulating these matters – not a court of law. In the end, their bottom line was "the existence and functions of drainage districts are so limited, the Iowa Supreme Court repeatedly, for over a century, has found districts not amenable to suit for damages, i.e., they are entitled to unqualified immunity."
Court Ruling in the DMWW Case
As reported in the online article of the Des Moines Register on Jan. 27, 2017, "the Iowa Supreme Court ruled that Des Moines Water Works cannot win damages under the Iowa Constitution against drainage districts in the three counties it is suing." The article includes an embed of the ruling in case anyone is interested in reading the court's explanation for each count of the complaint. The article also mentions there will be another ruling in June of this year to decide if drainage districts should be considered polluters under the Clean Water Act and subject to those regulations including the need to obtain permits for their discharges.
Why does this matter?
Water receives contaminants from natural and man-made activity, and removing those contaminants is not free. In the end, someone has to pay the cost, but who? In the Des Moines area, the cost to remove contaminants to provide safe drinking water is currently paid for by the DMWW which most likely passes the costs onto its customers. If the city subsidizes its utility for this purpose then the taxpayers of the city are also paying. But the people paying for that cost are not directly responsible for putting nitrates in the water. Instead studies show elevated contaminants in receiving streams are primarily a result of agricultural operations. (An earlier article in this blog cites a report indicating results of this in Illinois). So should agricultural operators pay the costs to remove contaminants?
Who pays is really what is being decided by lawsuits like the one brought by DMWW. In that case the court's decision leaves those using the water to bear the costs. Whether that is because of the manner in which the complaint was written or the specific defendents named, I cannot really comment on since I am not a lawyer. Articles and opinions I've read on the case indicate the matter is best left to legislators and regulatory agencies. What does seem obvious to me is no matter which entity pays, the cost will always ultimately be passed along to the end user. So whether it is the water or stormwater utility paying or the farmer, it seems we will pay for it through increased water bills to treat our water, taxes to clean our waterways, or grocery bills for increased costs for food production. So really the question should perhaps be How Do We Want to Pay for Clean Water?
According to a recently released Latham & Watkins Client Alert Commentary, the US Environmental Protection Agency (EPA) and the U.S. Army Corps of Engineers (Corps) jointly released a proposed rule on March 25, 2014, which would represent the most sweeping change in a generation to the rules governing federal Clean Water Act (CWA) jurisdiction.
Based on information presented in the commentary, it appears this new rule would expand the definition of "waters of the U.S." which would result in extending the jurisdiction of the Corps to areas not now regulated by this agency. The need for proposing this new rule has been explained by both agencies as necessary to, according to their press release, "clarify protection under the Clean Water Act for streams and wetlands."
The pre-publication version of the new rule (which is at this point a 370-page document) states:
Under the proposed first section of the regulation, section (a), the agencies propose to define the “waters of the United States” for all sections (including sections 301, 311, 401, 402, 404) of the CWA to mean:
• All waters which are currently used, were used in the past, or may be susceptible to use in interstate or foreign commerce, including all waters which are subject to the ebb and flow of the tide;
• All interstate waters, including interstate wetlands;
• The territorial seas;
• All impoundments of a traditional navigable water, interstate water, the territorial seas or a tributary;
• All tributaries of a traditional navigable water, interstate water, the territorial seas or impoundment;
• All waters, including wetlands, adjacent to a traditional navigable water, interstate water, the territorial seas, impoundment or tributary; and
• On a case-specific basis, other waters, including wetlands, provided that those waters alone, or in combination with other similarly situated waters, including wetlands, located in the same region, have a significant nexus to a traditional navigable water, interstate water or the territorial seas.
After reading through the pre-publication version and the Client Alert Commentary mentioned above, you might be left wondering just what area through which water can flow would not potentially be subject to the Corps jurisdiction. The proposed rule offers these exceptions:
Waste treatment systems, including treatment ponds or lagoons, designed to meet the requirements of the Clean Water Act.
Prior converted cropland. Notwithstanding the determination of an area’s status as prior converted cropland by any other federal agency, for the purposes of the Clean Water Act the final authority regarding Clean Water Act jurisdiction remains with EPA.
Ditches that are excavated wholly in uplands, drain only uplands, and have less than perennial flow.
Ditches that do not contribute flow, either directly or through another water, to a traditional navigable water, interstate water, the territorial seas or an impoundment of a jurisdictional water.
The following features:
artificially irrigated areas that would revert to upland should application of irrigation water to that area cease;
artificial lakes or ponds created by excavating and/or diking dry land and used exclusively for such purposes as stock watering, irrigation, settling basins, or rice growing;
artificial reflecting pools or swimming pools created by excavating and/or diking dry land;
small ornamental waters created by excavating and/or diking dry land for primarily aesthetic reasons;
water-filled depressions created incidental to construction activity;
groundwater, including groundwater drained through subsurface drainage systems; and
gullies and rills and non-wetland swales.
The reactions I've read to this proposed rule have been mixed. Some people in the industry are understandably concerned by what they believe to be an expansion of powers by both agencies and by the impacts the rule may have on project timelines and costs. Kevin Kelly, president of the National Association of Home Builders was quoted in the Wall Street Journal as saying, "EPA has added just about everything into its jurisdiction by expanding the definition of a 'tributary,' " However environmental groups have stated this proposed rule does not extend either agency's jurisdiction or regulation over any waters not currently covered by the Clean Water Act.
I would encourage everyone to perform their own review of the proposed rule and related literature and discuss it with the legal counsel for your agency, and then to comment once the proposed rule is officially published. Below are just a few links with additional information:
This year I am fortunate to again have the opportunity to attend WATERCON in Springfield, Ill.It's amazing how every year the conference offers so many great sessions, and the exhibitors always have such interesting displays and information. In addition to attending sessions and talking with vendors, I'll be posting as much as I can on several social media sites so that all of you can follow as much of the conference as possible. Because most of these sites are already listed in a blog post over at the Watercon blog site, I won't list them again here. Instead I encourage you to visit over there. And if you're attending too, I'll be looking for your own posts and photos from the event!
One added treat is a virtual expo we set up to try out that technology. Here's an image of the entry screen – you can find the link to visit the expo over on the Watercon site.