National Institute of Building Sciences Updates Mitigation Savings Ratio

Elevated House

On January 11, 2018, the National Institute of Building Sciences released their Natural Hazard Mitigation Strategies: 2017 Interim Report. This document reports an update to their 2005 determination of a mitigation benefit cost ratio of 4:1 where “for every $1 spent by FEMA on hazard mitigation, it is $4 in future benefits.” The new study has found this ratio has increased to 6:1 meaning “on average, mitigation grants funded through select federal government agencies can save the nation $6 in future disaster costs, for every $1 spent on hazard mitigation.”

The new study also broke out benefits of exceeding specific requirements of the 2015 model building code. It reports that, “on average, investments in hazard mitigation measures that exceed provisions of the 2015 model building code can save the Nation $4 for every $1 spent.”

While having additional data explains some of the finding of increased savings, there are other reasons this ratio is reported to be higher than the 2005 ratio. The newer study took a more in-depth look at costs and benefits and leveraged better analytical technologies.  This approach allowed for the inclusion of additional factors not considered in the 2005 study such as the following benefits and costs:

  • Benefits associated with avoided cases of PTSD.
  • Cost of lost wages
  • Losses in household productivity
  • Cost of pain and suffering

Another difference is the new study uses a discount rate of 2.2%. But even though this rate is below the higher discount rate used by the Office of Management and Budget, the study reports the measures remain cost-effective at the higher rate. This study also took into account information from 23 years of grants from EDA and HUD while the original analysis only looked at grants from FEMA.

You can read more about the entire study and findings at the National Institute of Building Sciences Website.  At this link you will be asked to provide your name and some brief contact information to download a summary, the full report, and fact sheets.

Share

The Day the FCC Took Broadband out of the Right of Way

Communications infrastructure in right of way

The use of public right of way is regulated by local or state government subject to local and state laws. Typically if a utility wants to install infrastructure in the public right of way, it must apply for and obtain a permit from the  government agency which has jurisdiction over the right of way. The installation and use of that infrastructure is then subject to the terms of that permit. Sometimes the issuance of the permit and the use is also subject to a franchise agreement negotiated between the local government and the utility. Utilities are also installed in utility easements which are designated on recorded plats of subdivisions. Private property owners typically own the underlying land which is subject to this easement. And the installation of the utillity in these easements is regulated by the local government through a permit and sometimes a franchise agreement. There have been additional regulations imposed through telecommunications acts. Often local government is restricted by these state or federal laws on the level of regulation that can be imposed on a public utility. Due to the telecommunications laws I have never heard of a use that was denied and instead have heard of court cases forcing cities to allow broadband companies to install their equipment in the right of way even when that installation was opposed by the city and the public.

Because the right of way and public utility easements are limited in area and because they are designated for public use, private parties are usually not granted permanent use of the right of way. Occasionally, limited uses are allowed such as street seating for restaurants or dog fences or sprinkler systems. In the case of use by a private entity, a legal agreement between the private entity and the local government is executed to permit the use. The local and state government has much more ability to charge fees and establish parameters for the use of public right of way when the applicant is not a utility or telecommunications company.

Keeping all that in mind, I can't help but wonder what will be the consequences of the FCC's net neutrality decision. From what I understand the premise of this action is the FCC is no longer going to define broadband companies as utilities and telecommunications. It appears instead the FCC's official position will be broadband companies are providing information services. Currently all of the major broadband companies have significant infrastructure in the right of way. Does this removal of a designation as a utility/telecommunication company mean local and state government can now regulate them as a private company? How about charge annual fees for use of the public right of way? And what about the infrastructure in public easements on private property? Is it legal for the company to keep its infrastructure in that utility easement? Can private property owners demand removal or payment? The next time a broadband company tries to install its Internet related equipment in my community, will the court again force the city to allow its installation as it did last time? Or since it's no longer a utility or telecommunication company, will the city prevail at denying the company access to the right of way?

With all the discussion online about the upcoming FCC decision, I've been surprised to see only one article touching on these issues and questions. The author of that article, "Ajit Pai's Net Neutraility Shell Game," suggested this reclassification will not take place and that this action by the FCC is only a ploy to force lawmakers into a position to concede even more power to broadband companies through additional telecommunication legislation. But if the FCC does end up moving forward with what they propose, I would expect eventually some local agency will test the legality of a broadband company's right to occupy the right of way. And if that litigation is found to have merit, permitting of right of way becomes a whole new playing field. 

Share

Bike Repair Stations

Bike Repair StationFortunately for bicyclists, public agencies are not only installing more bike trails, lanes, and shared use paths. Over the last few years many are also recognizing the need for support facilities and adding bike repair stations along these routes. The Fixit station shown in the photo above has an air pump to the left and a bike mounting/repair station on the right. This specific type of station includes the following tools which hang inside the station to assist in repairing your bike – a close up of these tools is shown below: Bike Repair StationTools

  • Philips and flat head screwdrivers
  • 2.5, 3, 4, 5, 6, 8mm Allen wrenches
  • 8, 9, 10, 11, 15, 32mm box wrenches
  • Tire levers (2)

This specific model, made and sold by Dero, is available in three styles and in many different colors and finishes including galvanized, thermoplastic, and powder coated. Their website offers CAD drawings, specifications, and other information. The company also publishes a map showing where their stations have been installed which might be helpful to bicyclists who are planning their routes. According to the map, bike repair stations have been placed in North and South America, Europe, Australia, and New Zealand. The company also offers other useful bicycle support structures such as shelters, lockers, racks, and signage.

Some agencies such as the Ventura County Fire Department (VCFD) have adopted an innovative idea of installing these stations at their own facilities. VCFD is taking advantage of National Bike Month to launch the installation of 16 repair stations at fire stations across the county. And they are hosting a Bike 'n' Ride event to celebrate. You can read more about the department's innovative support of their cycling community in this article in the Camarillo Acorn: "Fire stations across county to add bike repair services."

Share

Real Time Weather Mapping with mPING

mPING weather display

mPING, a real-time weather application, offers interactive insight into what is really going on with the weather in any location around the world. Users can access the app to either anonymously submit reports of current weather at their own location or view reports from others by downloading the app from iTunes or Google Play. All reports are shown through a repeating display over a specific time frame with an icon designating the specific type of weather such as rain, drizzle, snow, flooding, wind, and hail. The same map of the reports can also be accessed online at the mPING website. The image above is a screenshot from the mPING website of recent weather in the midwest. 

The app was launched in 2012 by developers from NOAA’s National Severe Storms Laboratory and University of Oklahoma and the Cooperative Institute for Mesoscale Meteorological Studies to assist in fine-tuning weather forecasts. According the the NOAA website, NOAA National Weather Service (NWS) forecasters can access the reports on their office workstations. This allows them to "overlay mPING reports with other data such as radar and satellite observations to aid them in their decision-making." Also the site reports that "television stations and private weather companies have the opportunity to build the ability to submit and display mPING submissions in their own branded applications, making the information available to the public in new ways."

Some tips to keep in mind while viewing the map:

  • The time frame displayed is over a three-hour period, and the time clock in the upper right corner is set to Greenwich time. (As an aside, per the NWS website: "All aspects of meteorology are based upon a world-wide 24-hour clock called Zulu time (Z), more commonly called Coordinated Universal Time (UTC). You will notice all weather maps, radar, and satellite images all have their time expressed in "Z". The Zulu term stems from military usage while Coordinated Universal Time is the civilian term for this 24-hour clock.")
  • You can start and stop the play of the weather reports by clicking the play/pause button in the upper right. This is the top button in the vertical line of three buttons located under a layer button.mPING menu buttons
  • A legend for the icons can be found by clicking the middle button in the vertical line of three buttons located in the upper right of the screen. Below is a screenshot of the legend which will slide out after clicking this button. This legend also shows the type of reports which can be submitted. (Click the image for a higher resolution view.)mPING Icon Legend
  •  The bottom button in the vertical line of three buttons can be used to turn on and off the history of weather. Turning it on means that over the three-hour display all weather events will remain showing in the display. Turning it off means that as the weather plays out over the three-hour time period shown, you will only see weather reports at the time they were reported.
  • The layer button at the very top of the upper right of the screen allows the user to change to a topographic background instead of the black default background shown here.
Share

2017 National Engineers Week Educational Resources

2017 National Engineer's Week

An increasing number of STEM professionals have been flooding the market for the last decade, yet in the next ten years there will be a shortage of professionals in the field. The U.S. Bureau of Labor Statistics estimates that from 2012 to 2022, STEM employment rates will grow by 13%, higher than the 11% projected growth across all other occupations. And yet by 2025, the U.S. will need approximately one million more professionals than it will have produced.

Engineers Week is one step towards a solution to this conundrum. The 66th Engineers Week, which started on February 19th, is being celebrated in schools across the nation. With new initiatives such as the Future Cities Project and Girl Day, Engineers Week aims to inspire the next generation of engineers who will help steer the U.S. as a global leader in the fields of science, technology, engineering, and mathematics. Below you will see a number of academic infographics that showcase how the future generation of engineers can impact the world.

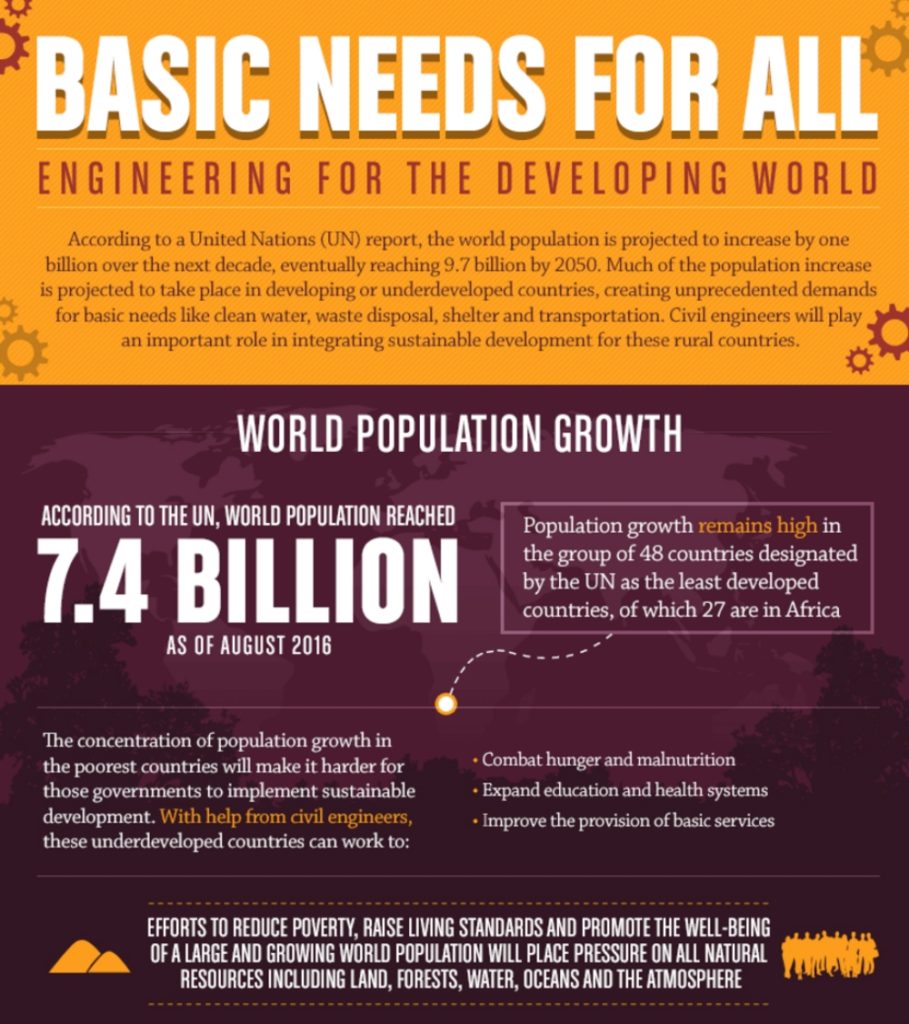
From 7.4 billion in 2016 to 9.7 billion in 2050, the world's population will continue to grow over the next decade, and the brunt of the baby boom will be centered around developing countries. The problem is that these same regions do not have sufficient infrastructure to cope with the rapid growth.

The challenge to bring basic infrastructure to the developing world now falls on the shoulders of the next generations of engineers. By having a STEM expertise, it will not only put them in the forefront of science and technology, but it provide them with the skills to steer the world towards a better future. To learn more about engineering infrastructure for the developing world, check out the infographic below created by Norwich University’s Online Master in Civil Engineering program.

Infographic - Engineering

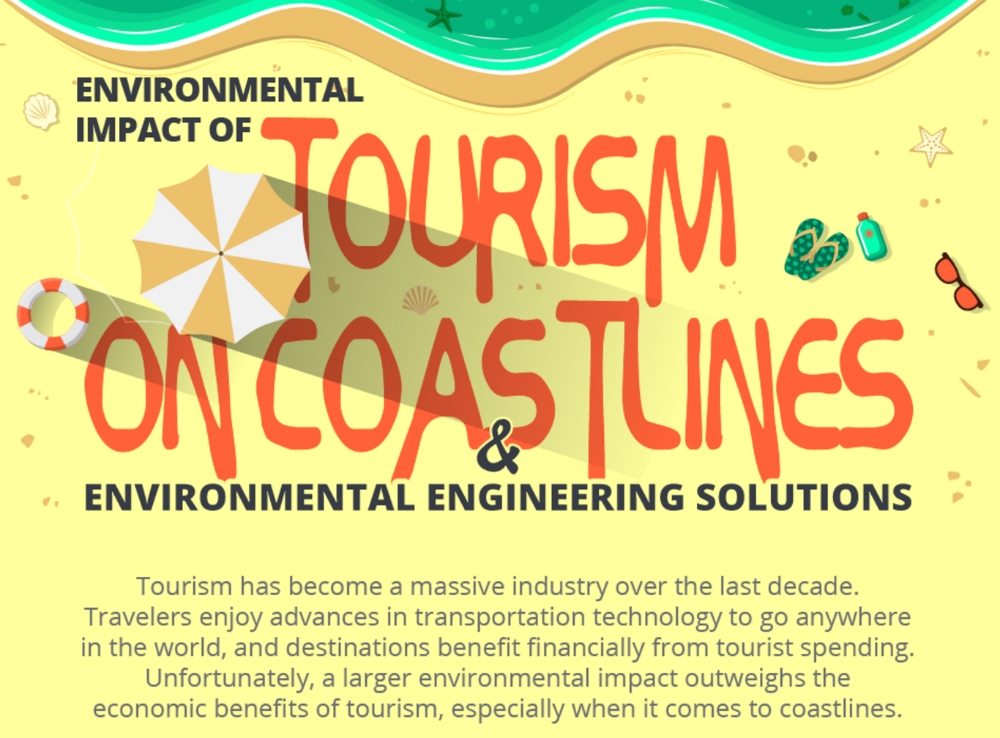
Technological advances in transportation and information technology have resulted in a global tourism boom in recent years. The good news: the economies of both leading and emerging destinations have been positively impacted. The bad news: the rise in coastal tourism is taking a toll on the environment. The silver lining: the continuing surge in global coastal tourism has indirectly caused more demand for environmental engineering professionals.

Indeed, the next generations of environmental engineers will have to propose and develop sustainable coastal tourism solutions that aren't focused on doing the tourists a favor — they're literally saving the planet, one tourist destination, coast, and reef at a time. To learn more about how engineers can help build sustainable coastal tourism, check out this infographic below created by Ohio University’s Online Master of Science in Civil Engineering program.

Infographic - Engineering the Coastlines

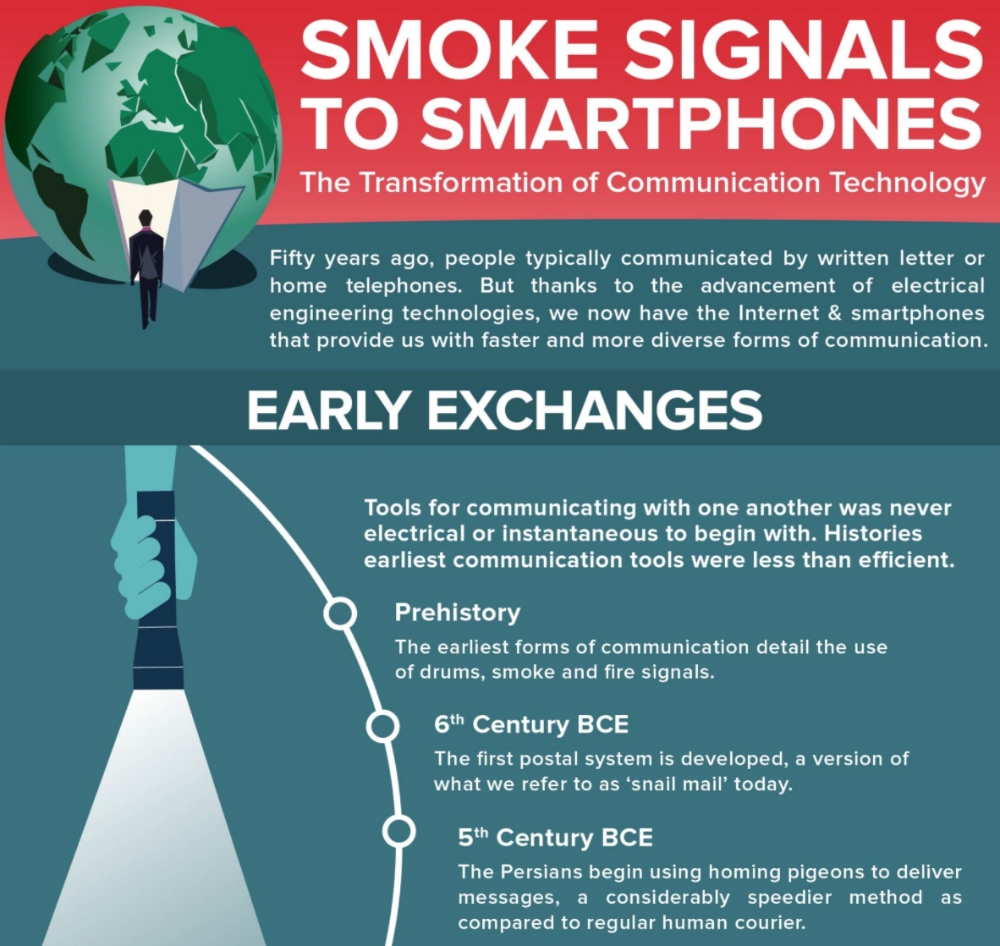
Modern communication technology is one of the most promising fields of the future. From homing pigeons to telegraphs to status updates, the advances in modern communication have supported the advance of civilization for ages. At the heart of it all, electrical engineers are solving the real world problems that allow these communication technologies to function and progress.

What's next for the electrical engineers of the future? Will virtual and augmented reality communication be commonplace? Will the Internet of Things take over?

Electrical engineering has never been as game-changing a field as it is today. To learn more about electrical engineering's impact on communication, check out this infographic created by the New Jersey Institute of Technology’s Masters in Electrical Engineering program.

Infographic - Communications

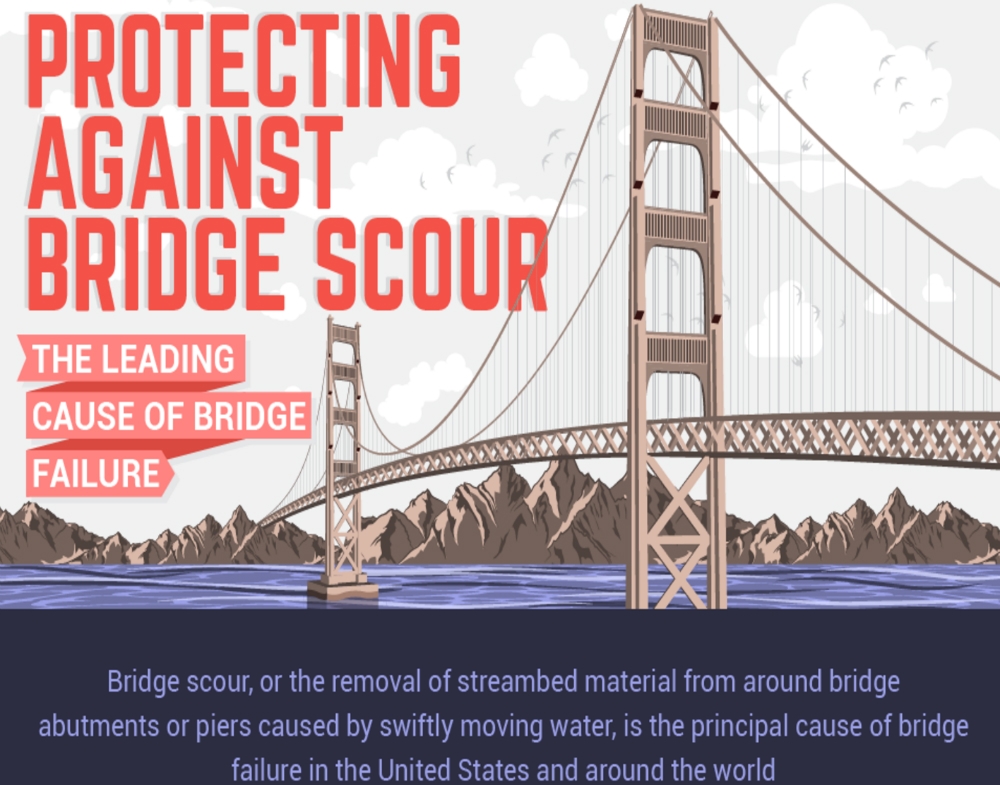
Roads, bridges, and other critical infrastructures are the hallmarks of modern civilization. The bridges of today are not only a testament to the cultural aesthetics and norms of the period, but also the technological prowess of society.

However many of our bridges are crumbling and scouring due to several causes. We need a new generation of engineers to not only preserve the architectural symbols of our culture, but also adopt a modern approach to the renovation of existing bridges and planning of new ones. These engineers are ensuring the safety of the people using the infrastructure today and a century from now. To learn more about engineering strategies that prevent bridge failure, checkout the infographic below created by the New Jersey Institute of Technology’s Master of Science in Civil Engineering Online program.

Infographic - Bridge Scour

– by Austin Anderson, Circa Interactive

Share